Hurricane Sandy (2012)
Hurricane Sandy occurred between 22 and 29 October 2012. It was classified as a category 1 hurricane before hitting Jamaica and by the time it reached Cuba it was a category 3 hurricane. However, before reaching southeastern United States it weakened and by the time it hit northeastern United States it was an extra tropical storm. Major storm surge records with extensive damage happened during this hurricane along New England. Inundation up to 9 feet above ground level was observed along large portions of the New Jersey, New York, Connecticut, Rhode Island, and Massachusetts coast. Maximum sustained winds up to 83 knots were recorded during this Hurricane in the United States. There was a total of 72 fatalities in the United States with about $50 billion property damage, making Sandy the second-costliest cyclone to hit the United States since 1900 [NOAA, 2013]1.
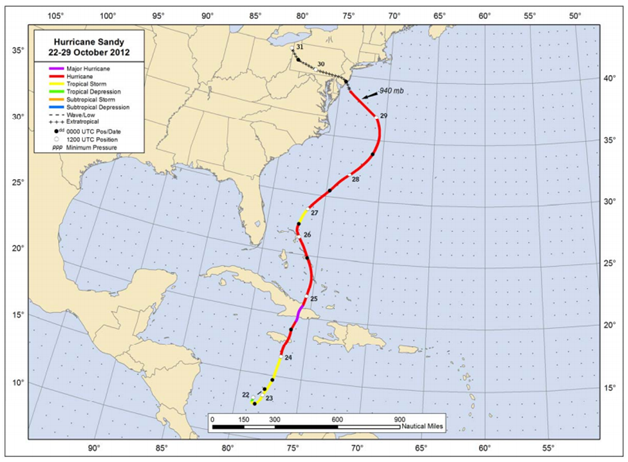
Figure: Best track positions for Hurricane Sandy, 22 - 29 October 2012 (Source: NOAA1)
1Blake, E. S., Kimberlain, T. B., Berg, R. J., Cangialosi, J. P., and Beven II, J. L., (February 2013), Tropical Cyclone Report Hurricane Sandy (AL182012) 22 – 29 October 2012, National Oceanic and Atmospheric Administration – National Hurricane Center.
Digital Elevation Model
| File Name | Description | Source |
|---|
| Coastal Topography–Northeast Atlantic Coast, Post-Hurricane Sandy, 2012 |
This Data Series contains LiDAR-derived bare-earth (BE) topography, dune elevations, and mean-high-water shoreline position datasets for most sandy beaches for Fire Island, New York, and from Cape Henlopen, Delaware to Cape Lookout, North Carolina. The data were acquired post-Hurricane Sandy, which made landfall as an extratropical cyclone on October 29, 2012. |
USGS |
Imagery
Miscellaneous
| File Name | Description | Source |
|---|
| Hurricane Sandy 2012 |
Including tropical cyclone report, aircraft missions, surface wind field analyses, satellite pictures, wind centers and tracks, radar composites, stepped frequency microwave radiometer, dropsonde data, and photos from flights |
NOAA – Atlantic Oceanographic & Meteorological Laboratory |
Presentation
| File Name | Description | Source |
|---|
| Hurricane Sandy |
An overall presentation about Hurricane Sandy, some benchmarks, and its damage |
NOAA – National Hurricane Center |
Report
| File Name | Description | Source |
|---|
| Superstorm Sandy LIDAR Damage Assessment To Change Disaster Recovery |
Using mobile Light Detection and Ranging (LiDAR) technology to assess storm damage on buildings, roadways, and utilities in the devastated coastal communities of New York and New Jersey. |
DOT – Office of Research, Development and Technology |
| Tropical Cyclone Report Hurricane Sandy |
The National Hurricane Center's Tropical Cyclone Reports (formerly called Preliminary Reports) contain comprehensive information on each storm, including synoptic history, meteorological statistics, casualties and damages, and the post-analysis best track (six-hourly positions and intensities). |
NOAA – National Hurricane Center |
| FEMA P-942, Mitigation Assessment Team Report: Hurricane Sandy In New Jersey And New York (2013) |
FEMA P-942 documents observations made during field visits conducted by the Mitigation Assessment Team (MAT) following Hurricane Sandy, specifically deployed to evaluate key building damages. FEMA P-942 presents the conclusions and recommendations derived from the field observations with regards to key engineering concepts, codes and standards, mitigation measures and considerations that can be used in the planning and recovery process to help minimize future damage to structures and their related utility systems. |
FEMA |
| Service Assessment: Hurricane/Post-Tropical Cyclone Sandy, October 22–29, 2012 |
The NWS conducts service assessments of significant weather-related events that result in at least one fatality, numerous injuries requiring hospitalization, extensive property damage, widespread media interest, or an unusual level of scrutiny of NWS operations by the media, EMs, or elected officials. The intent of service assessments is to thoroughly evaluate the NWS performance and ensure the effectiveness of NWS products and services in meeting its mission. |
NOAA - National Weather Service |
| Monitoring Storm Tide and Flooding from Hurricane Sandy |
Monitoring Storm Tide and Flooding from Hurricane Sandy Along the Atlantic Coast of the United States |
USGS |
| Coastal Change from Hurricane Sandy and the 2012–13 Winter Storm Season: Fire Island, New York |
The U.S. Geological Survey (USGS) assessment of the morphological impacts to the beach and dune system at Fire Island, New York. |
USGS |