/prod01/channel_54/media/fit-website/site-assets/images/FT-Horiz_crimson-gold.png)
/prod01/channel_54/media/header-images/CMSrealSize5000_final_darker.jpg)
Quarknet Workshop and Web Portal Use:
Undergraduate Research Semester Report
Julie M. Slanker
The Quarknet work this semester focused mainly on scheduling for the workshop, which took place on April 8, and using the web portal supported by Fermi Lab. There has also been some planning for the week long summer workshop beginning on June 13. The April 8 workshop provided valuable lessons about the types of reminders that should be sent out prior to a data taking event, and also about the commitment of the teachers during the school year. Numerous problems with the web portal have been uncovered, and representatives from Fermi Lab have already begun to sort them out. Hopefully, by June 13 all glitches will be out of the system, and a smooth week long data run can take place.
The day long workshop was attended by four area high school teachers and two high school students, and was facilitated in part by Bob Peterson, a Quarknet staff member from Fermi Lab. The detectors were set-up in a house shaped pattern in the Experimental Hall in the new Physical Sciences building at Florida Tech. It took the teachers over two and a half hours to set up their detectors, and for us to debug all of their issues. There were also problems with reading the data through the RS232 to USB adaptors, and a new adaptor with drivers had to be purchased in the middle of the workshop. As a group, data was taken for only about two hours, and then the teachers learned how to upload data and set the geometries of their detectors.
The next year of data taking in the class room will require much more involvement from Florida Tech. The teachers do not us their detectors often, and in many cases had not turned them on since the previous workshop during the summer of 2004. This was evident by their lack of understanding on how to plug their detectors in and what commands to send to the laptop computers used for collecting data. There was also no evidence that the second teacher in each pair had received the detectors for use half way through the school year, and there was no organized effort to turn on the detectors during the Thursday evening, designated data collection time. Next year, representatives from Florida Tech should send out reminder emails before the designated time, and also set up a deadline for posting each week's data on the web portal. That way, if data is not uploaded, the teachers who are having problems can be sought out and helped.
There should also be a designated data-run/ detector pick-up day scheduled for August, when Florida Tech is finished with its own summer student program. There should also be a data-run/detector swap day scheduled for November. This way, the detectors will be sure to make it to the second classroom. A third data-run/detector drop-off day should be schedule for late April, where the teachers will get together, and have the opportunity to bring their detectors back to Florida Tech, if they have finished using them in the classroom. Under this schedule, there will be two times throughout the year for the teachers to actually use their counters, even if their classroom situation does not support a weekly data run. They will also find out BEFORE the summer session, if they have a light leak or other detector problem that can be easily fixed.
Before each data-run event, the teachers should be reminded to bring their detectors, their logbooks, and any supporting materials or information they have accumulated over the year. They should also be asked to bring their laptop, and if they do not have an RS232 port, they should be reminded to check and be sure that their RS232 to USB adaptor works with their computer. This will save time and will allow the teachers to download any necessary drivers before coming to the workshop. If the teacher knows that their detector is not working properly, they should schedule a time to drop it off before the workshop so that the necessary adjustments can be made. Also, if the teachers a having problems with their detectors during the school year, they should contact Florida Tech, and either bring it in or have someone come out to their school with the fast oscilloscope and laptop computer to get everything running properly. It would also be good for teachers to email Bob Peterson directly when they have problems with the web portal, making sure to copy the rest of the Quarknet group. That way they will be actively trying to fix their own situation and the rest of the group, who may be having a similar problem, can be included.
The web portal, on the surface, is user friendly with advanced analysis features. However, upon closer inspection it raises some issues. Some of the problems are simply with data display. When looking for an air shower, the coincidences are grouped by number of events, instead of by time. The figure below is an example of the display for data taken on April 29 using three detectors in a stacked set-up.
|
Event Date |
Event Coincidence |
Detector Coincidence |
|
Apr 29, 2005 7:31:55 PM CDT |
5 |
3 (144 9 140) |
|
Apr 29, 2005 7:01:08 PM CDT |
5 |
3 (144 9 140) |
|
Apr 29, 2005 3:56:02 PM CDT |
4 |
2 (9 140) |
|
Apr 29, 2005 3:54:47 PM CDT |
4 |
2 (144 9) |
|
Apr 29, 2005 3:50:07 PM CDT |
4 |
2 (144 140) |
|
Apr 29, 2005 3:06:05 PM CDT |
4 |
2 (144 140) |
|
Apr 29, 2005 2:50:40 PM CDT |
4 |
2 (144 140) |
|
Apr 29, 2005 7:40:41 PM CDT |
4 |
2 (144 140) |
|
Apr 29, 2005 2:29:16 PM CDT |
4 |
2 (9 140) |
|
Apr 29, 2005 7:19:01 PM CDT |
4 |
2 (9 140) |
|
Apr 29, 2005 7:09:58 PM CDT |
4 |
2 (144 140) |
|
Apr 29, 2005 7:07:54 PM CDT |
4 |
2 (9 140) |
|
Apr 29, 2005 7:02:53 PM CDT |
4 |
2 (144 9) |
|
Apr 29, 2005 4:27:51 PM CDT |
4 |
2 (144 140) |
|
Apr 29, 2005 2:27:51 PM CDT |
4 |
2 (144 140) |
|
Apr 29, 2005 3:12:51 PM CDT |
3 |
2 (144 140) |
|
Apr 29, 2005 2:31:56 PM CDT |
3 |
3 (144 9 140) |
|
Apr 29, 2005 7:49:08 PM CDT |
3 |
3 (144 9 140) |
|
Apr 29, 2005 6:48:50 PM CDT |
3 |
2 (9 140) |
|
Apr 29, 2005 4:19:05 PM CDT |
3 |
2 (144 140) |
|
Apr 29, 2005 4:15:38 PM CDT |
3 |
2 (9 140) |
|
Apr 29, 2005 7:10:30 PM CDT |
2 |
2 (144 140) |
In order to tell if there had actually been an air shower, the data must be exported to Excel and rearranged by time.
Another problem with the web portal is that there is no difference in the data analysis if the scintillation panels are stacked or un-stacked. When running an air shower study, each of the coincidence events is plotted with area in the horizontal plane and time along the z-axis. Although the geometry of the detector is uploaded into the portal, when the detectors are stacked the analysis tools do not count a coincident hit in each panel of a single detector as one event, but as separate events.
This is clear from the figure below; the events are marked with a red diamond. In the detector set-up all scintillation panels are separated by equal distance. The time separation between two events in the same detector is roughly equivalent for all detectors, which shows that the portal will display a hit in a single scintillation panel and count it as an event.
The flux analysis tools do not distinguish between stacked and un-stacked set-ups either. When the analysis is done, the user can determine witch panel they would like to see flux data for. This isn't so much of a problem when the separation between detectors is small. Flux is a function of the stereo angle covered by the detector, and when distance between the panels is small, the stereo angle approaches 2 p . Since the data taken using a stacked set-up is presumably coincidence only, the flux through one panel is a good approximation of the flux through the whole detector. However, if the large swivel mount is used, the distance between the detectors becomes a factor, and the stereo angle covered is less than 2 p .
It is surprising that the web portal would run muon shower or flux analysis on data taken with the panels un-stacked. Coincidence is used to determine if the energetic particle causing the scintillation material to flash is in fact a muon. When the panels are un-stacked there is no reliable process for discriminating out electrons or other background radiation. The performance study on the web portal allows the user to check their data, to see if they are letting in too much low energy, background noise. But discriminating out the background signal caused by radio stations and other sources will not determine if the particle counted was a muon, an electron, or something else. Taking data with the panels un-stacked could allow soft component of air showers to be observed. But this is not muon flux, and should not be interpreted as such.
The web portal also has some problems with saving detector geometry, but that is currently being fixed. The positive side to the current issues with the web analysis is that the Quarknet staff at Fermi Lab is quick to take action and fix any problems or make improvements. The portal has good educational materials and provides good information about muons and the detectors. At a fundamental level the analysis tools are quite useful for providing examples and plotting results. Only when advanced analysis is required, does it come up short.
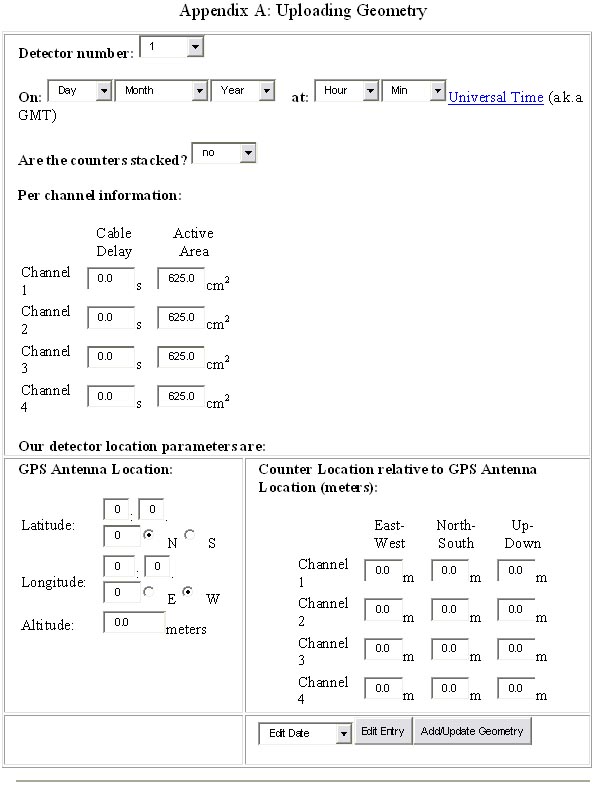
Steps for entering geometry:
- Choose the detector number
- Enter the date and time in UT, making sure that the time is BEFORE the data run began
- State whether the detectors are stacked or un-stacked
- Enter the cable delay for each channel, usually marked on the LEMO cables or assume 1ft/ns
- Enter the detector area for each channel
- Enter the GPS location found using the DG command (for display geometry) in the HyperTerminal
- Enter the location of the detector relative to the GPS antenna. North and East are positive, West and South should be entered as negative values.
- Click Edit/Update geometry.