/prod01/channel_54/media/fit-website/site-assets/images/FT-Horiz_crimson-gold.png)
/prod01/channel_54/media/header-images/olin-quad.jpg)
The Impact of Climate Change on Mountain Glaciers
Recent climate changes have had widespread impacts on human and natural systems. These impacts include global sea level rise; shrinking glaciers; ocean acidification; changes to hydrologic cycles; smaller crop yields; more heat waves, droughts, and floods; and numerous other changes to natural and biological systems, including the extinction of some species. This research project focuses on the impacts of a changing climate on mountain glaciers. Glacial ice covers over 15 million square kilometers across the globe, with one percent of that area being contained in mountains. Because of their global domain, mountain glaciers provide excellent evidence of climate change both regionally and globally. Glaciers are particularly sensitive to changes in temperature and precipitation. This makes glaciers excellent probes of climate change and historical variations in the extent of mountain glaciers give insight into natural and forced changes of these bellwethers of the climate.
In this project, we study mountain glacier change and investigate whether glacier change is correlated with climate change. To achieve this, we will develop a model to estimate mountain glacier change over time. The model can be used for monitoring mountain glacier changes and the prediction of glacier change in near future.
We implement the regression model using R (from polar coordinates) where response is glacier terminus and climate factors including precipitation, global air temperature data, sea level, and sea surface temperature are independent variables. We will study periods of glacier recession and glacier advancement and their potential correlations with the climate change and we use the model for predicting the glacier change for future years.
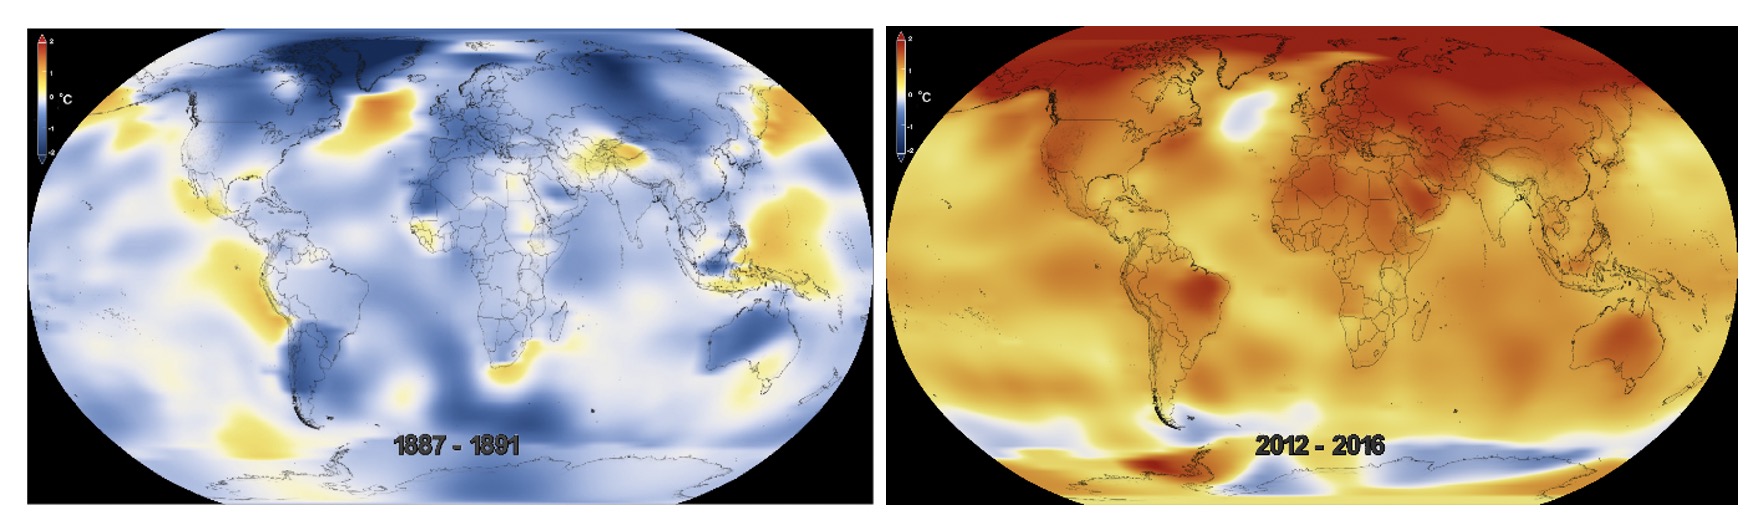
NASA Five-Year Global Temperature Anomalies 1887-1891 (Left) and 2012-2016 (Right).
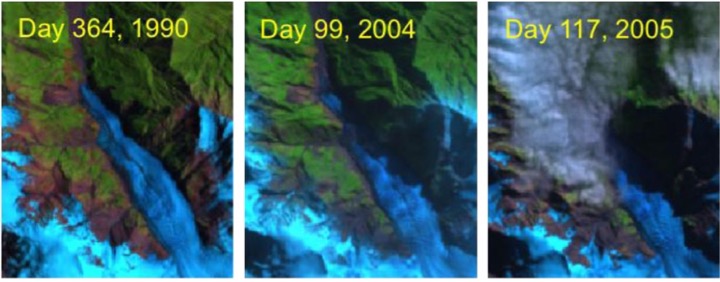
Landsat images of Franz Josef corresponding to different date, where the glacier path is clear in the left, is partially occluded with shadows in the middle, and is occluded by clouds in the right.
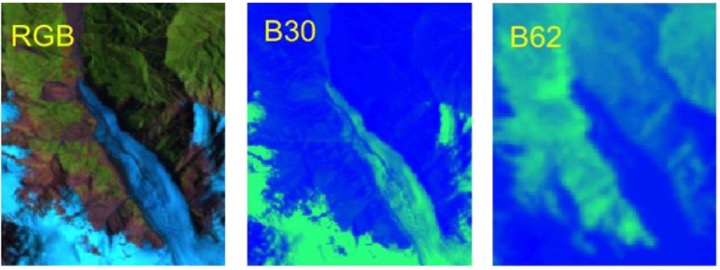
Landsat multispectral images of Franz Josef glacier in New Zealand.
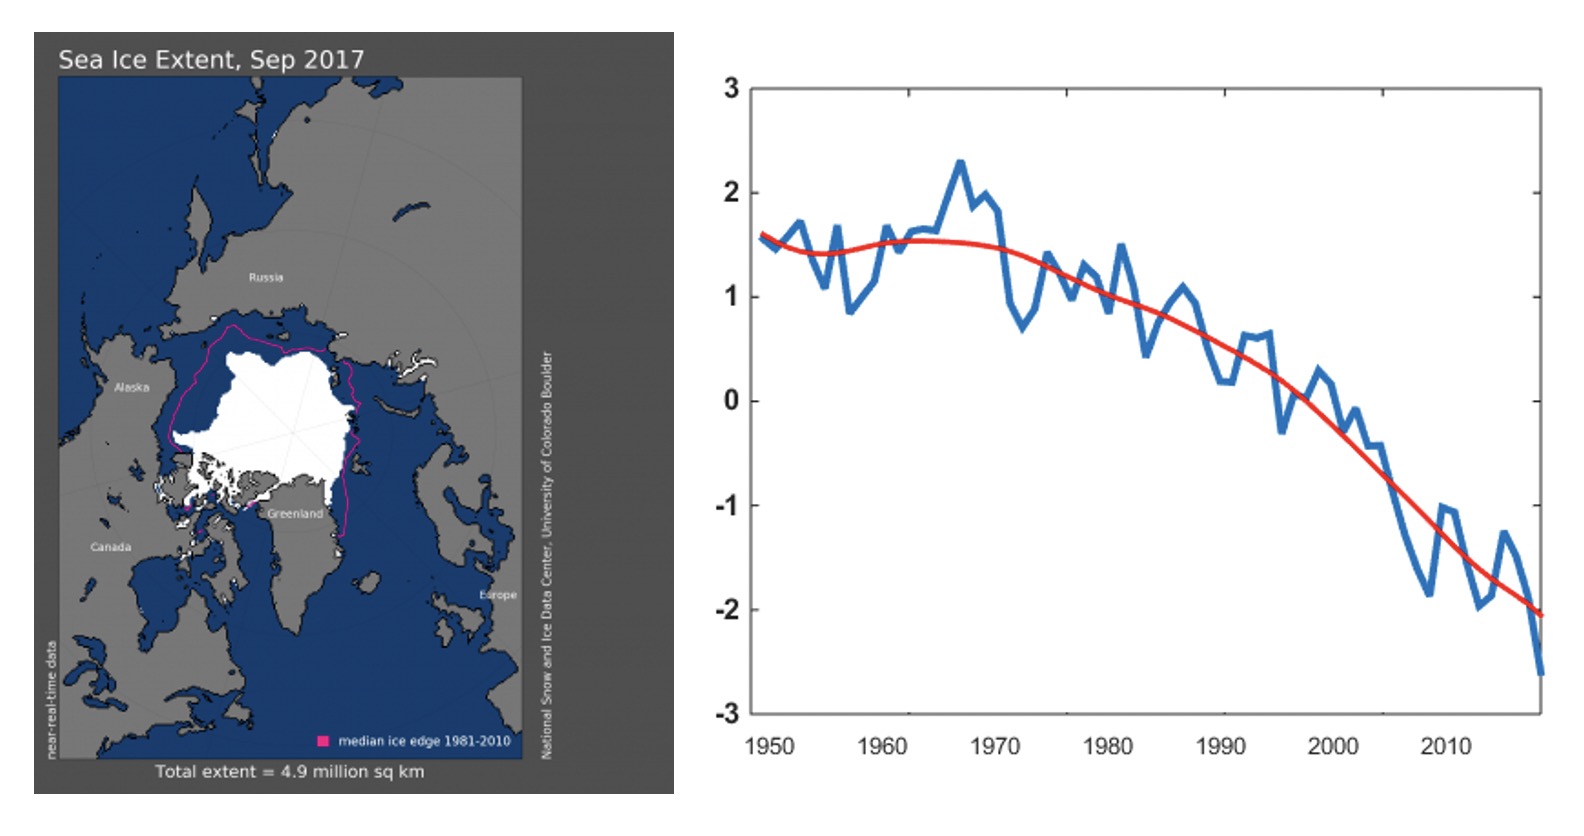
Northern Hemisphere Sea Ice Extent: (Left) September 2017 by National Snow and Ice Data Center, University of Colorado Boulder. Total extent is 4.9 million sq. km; (Right) Sea Ice Extent (Y axis) between 1953 and 2017 (X axis).
Assessing the Impact of Benthic Communities on Water Filtration in a Coastal Estuary
Oyster reefs are known to provide many benefits to coastal ecosystems, one of which is their ability to filter large volumes of water. This process removes suspended particulates from the water column, including harmful algal species, and improving water clarity. Oyster populations throughout our local estuary, the Indian River Lagoon (IRL) have also decreased as a result of overharvesting, habitat degradation, and low salinity. In addition to oysters, there are other benthic organisms (e.g. barnacles, sponges, sea squirts) present within the IRL that have the ability to filter water.
In 2013, the Living Docks program was started at Florida Tech to promote the settlement of filter feeding benthic organisms to oyster mat substrates affixed to dock pilings in an order to help improve water quality. As Living Docks are implemented throughout the IRL, it is important to understand the impact these systems are having, especially when the IRL (and other coastal ecosystems) are faced with algal blooms that are increasing in number and abundance. The objectives of this project are to 1) compare the benthic community composition at several Living Dock locations in the IRL, 2) predict the filtration rates of a whole Living Dock community (e.g. oysters, barnacles, sponges, tunicates, etc.) at these locations, and 3) determine the tolerance of the benthic communities to algal bloom conditions.
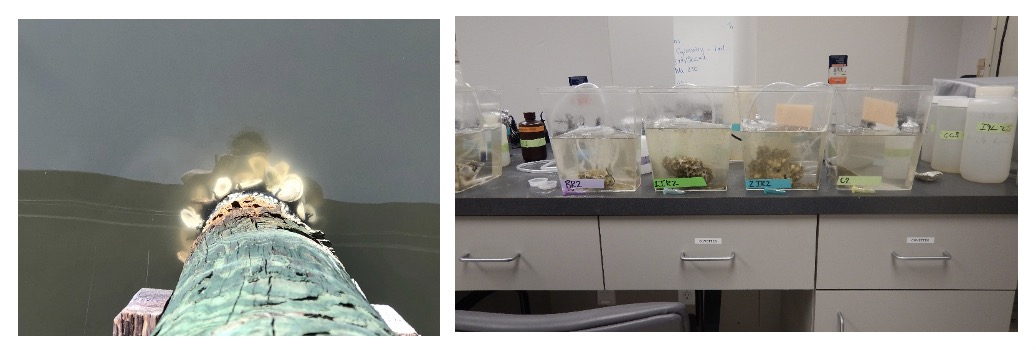
Left: Oystermat Piling; Right: Filtration Experiment.
Impact of Climate Change on Ciguatera in Florida and Caribbean
Fishes have long been the main source of protein for coastal dwelling people in Florida and the Caribbean and have sustained human populations for millennia. Yet an exclusive reliance on fishes can be disastrous for a population when those resources become depleted, or inedible, particularly from ciguatoxins that make fishes poisonous. In Florida few people today rely solely on fishes in their diet, although there are hundreds of thousands of recreational fishers that consume fish. By contrast, thousands of people in the Caribbean still rely on fishes as a chief source of protein. Fishes can become toxic to human consumption when they inadvertently ingest dinoflagellates that contain ciguatoxins. Ciguatera poisoning effects on average about 250,000 people annually worldwide. Today the outbreaks of ciguatera poisoning remain elusive and moreover the underlying factors driving ciguatera in Florida and the Caribbean has not been rigorously tested. The goal of this research is to address this problem in relation with changing climate factors and develop relevant statistical methods for estimation of ciguatoxicity.
We examine the relationship between cases of ciguatera poisoning in Florida and environmental factors including sea surface temperature, sea level, and the frequency and intensity of hurricanes. Students will develop a ciguatera fish poisoning monitoring to address the hypothesis whether the ciguatera poisoning has been influenced by climate change over past decades and what is the prediction of ciguatera poisoning for the next decade. We design a regression model with ciguatera fish poisoning as response and climate factors as independent variables.
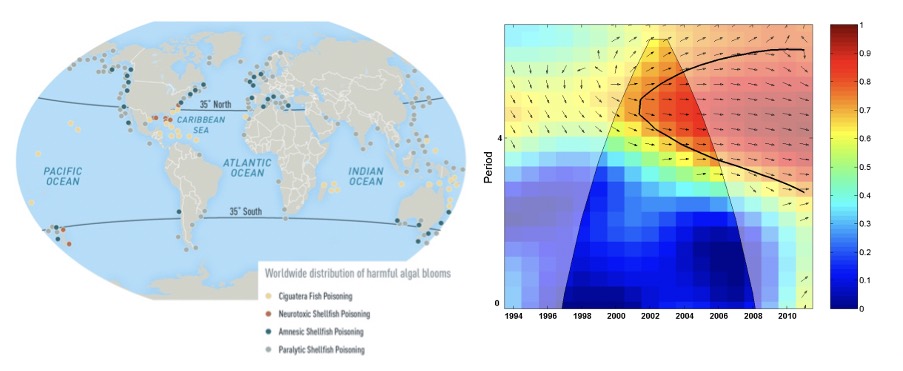
Left: Areas reporting select harmful algal blooms - Worldwide spread of Ciguatera poisoning marked in yellow. Harmful algal bloom data from Woods Hole Oceanographic Institution, Woods Hole, MA: 2015.
Available from: http://www.whoi.edu/redtide/regions/world-distribution
Right: Wavelet-coherence analysis of reef disturbances and cases of ciguatera poisoning (for Rarotonga in the Pacific Ocean (from Rongo and van Woesik 2013).
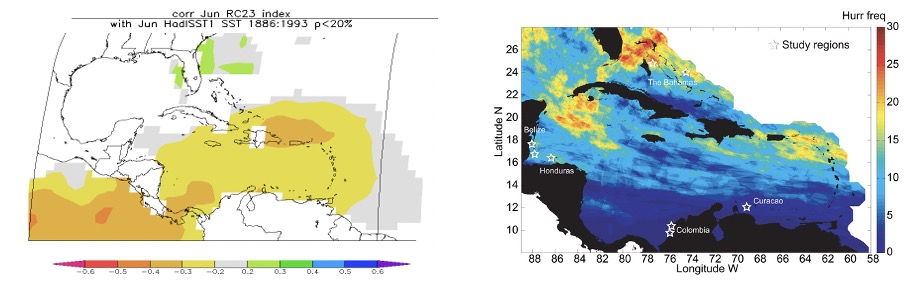
Left: Correlation of the annual mean of the high-frequency (>5.7 year) component with the detrended, annually resolved 1° by 1° globally gridded HADISST sea-surface temperature data over the common time period (1886-1993) where shading represents the strength of the correlation.
Right: Right. Frequency of occurrence of category 1-5 hurricanes in the Caribbean from 1863 to 2004 (from Foster et al 2013; PLoS One 8(1): e53283).
Sea Level Rise Projections and Modeling using Simulations and Observations
Global sea levels are rising at rates on average on the order of 3 mm/yr. The rising rate and its acceleration are alarming. Given that the world’s populations are concentrated along coastlines, investment in infrastructure, sustainability and eventual migration are becoming a significant part of the mitigation discussion. In the east coast of the US, these issues and problems that will be particularly acute given 2069 miles of the Atlantic coastline and 28,673 miles of the tidal shoreline. For example, in Florida, estuaries such as the Indian River Lagoon, Barrier islands, Florida Bay, and the Everglades are just a few of the vulnerable ecosystems that will be impacted with virtually all of Florida’s 21 million residents affected either directly or indirectly such as pressure-head related effects which will lead to increased inland flooding and saltwater intrusion. Given that most of Florida’s population lies in coastal counties, the projected economic impacts are substantial.
The goal of this project is to discover the global linkage between a warming planet and sea level rise. We develop a model to study the relation between sea level change (response) and climate factors (independent variables) by incorporating historical data and local measurements such as tide gauge.
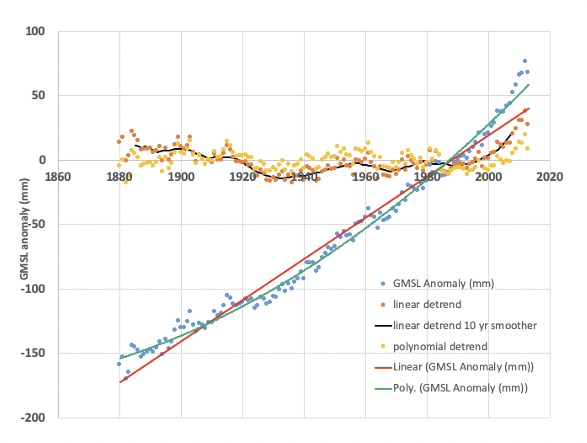
Global mean sea level anomaly (mm) 1880-2017 (blue) and detrended anomalies (orange and gold).
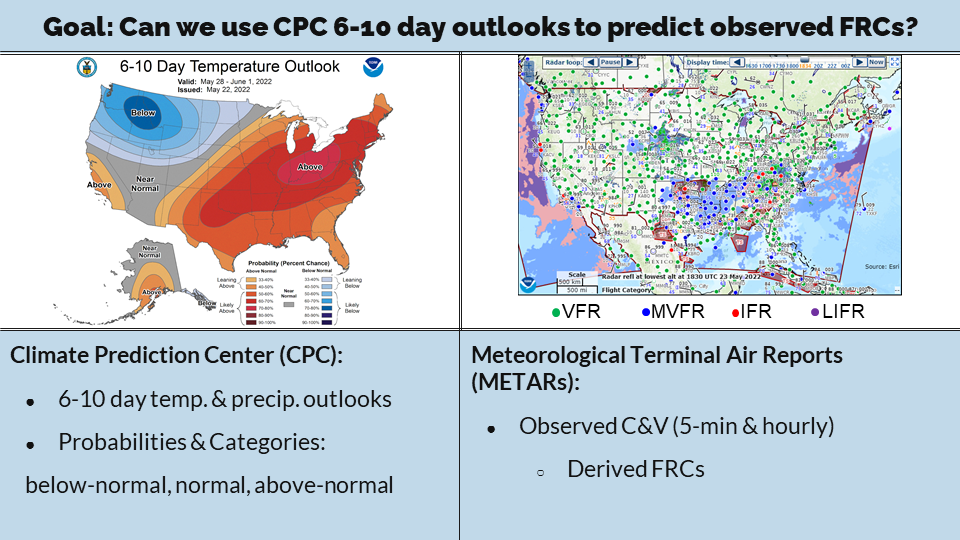
Flight Rules Category (FRC) Prediction Using CPC 6-10 Day Forecasts
Can Climate Prediction Center (CPC) 6-10 day outlooks be used to predict observed Flight Rules Categories?
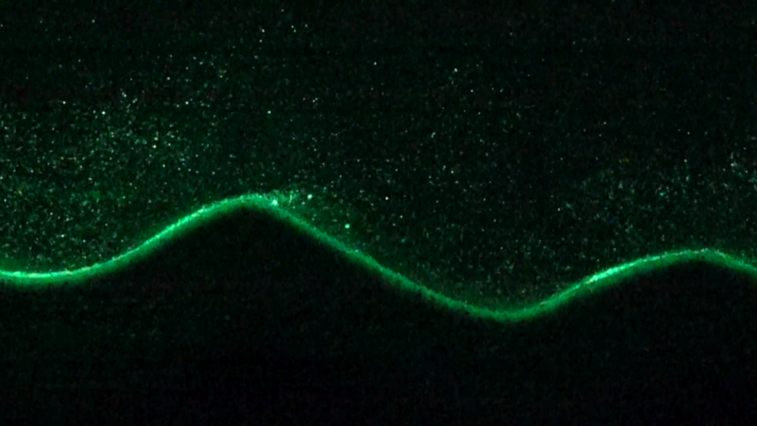
Sediment Transport Analysis with Applications to Coastal Resilience
Utlizing Particle Image Velocimetry (PIV).

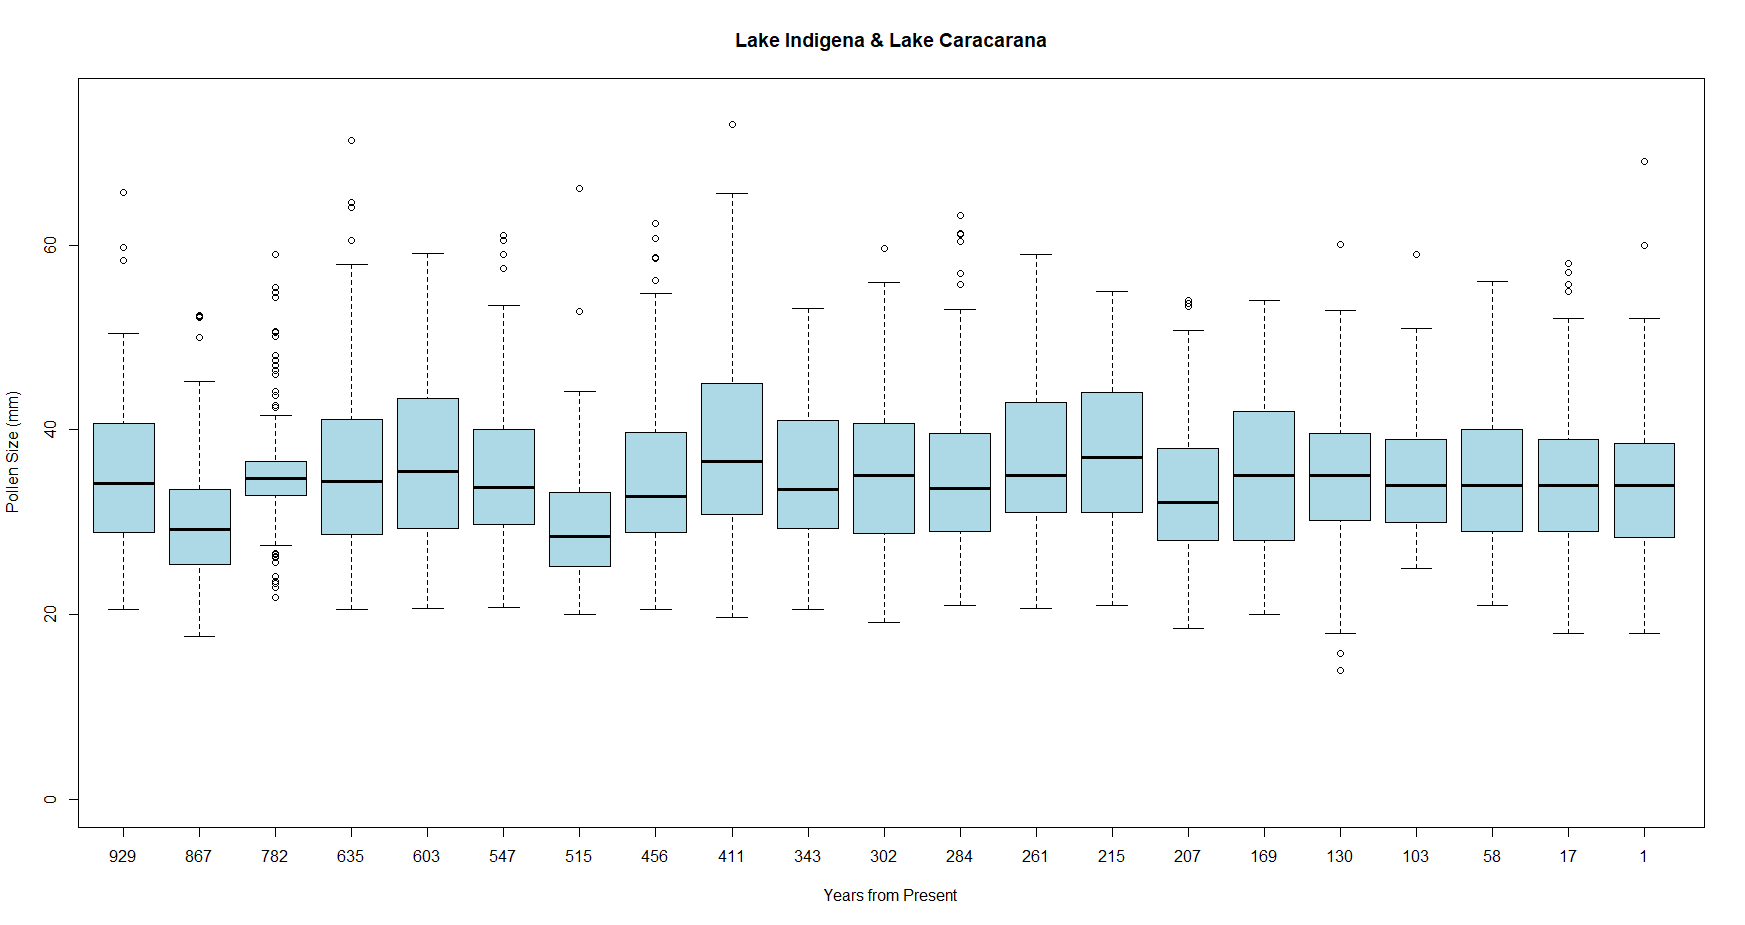
Comparing Pollen Size Distributions in South America
Fossil records can provide insights into the characteristics of an environment and the state of the vegetation. In order to learn more about the dynamics of savannahs in northern Brazil, the distribution of pollen fossil sizes was graphed for 21 different time periods throughout the past 1,000 years. The distributions of adjacent time periods were compared in order to identify time periods where major ecological changes occurred. Summary statistics were collected and statistical tests were performed on pairs of adjacent time periods to quantify the changes in distribution from one time period to the next. The time periods with the most significant changes were then considered for further investigation.